Excel:
-
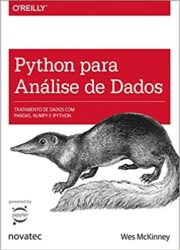 Python para Análise de dados: Tratamento de dados com Pandas, NumPy e IPyhon
Obtenha instruções completas para manipular, processar, limpar e extrair informações de conjuntos de dados em Python. Atualizada para Python 3.6, este guia prático está repleto de casos de estudo práticos que mostram como resolver um amplo conjunto de problemas de análise de dados de forma eficiente. Você conhecerá as versões mais recentes do pandas, da NumPy, do IPython e do Jupyter no processo. Escrito por Wes McKinney, criador do projeto Python pandas, este livro contém uma introdução prática e moderna às ferramentas de ciência de dados em Python. É ideal para analistas, para quem Python é uma novidade, e para programadores Python iniciantes nas áreas de ciência de dados e processamento científico. Os arquivos de dados e os materiais relacionados ao livro estão disponíveis no GitHub. Utilize o shell IPython e o Jupyter Notebook para processamentos exploratórios; conheça os recursos básicos e avançados da NumPy (Numerical Python); comece a trabalhar com ferramentas de análise de dados da biblioteca pandas; utilize ferramentas flexíveis para carregar, limpar, transformar, combinar e reformatar dados; crie visualizações informativas com a matplotlib; aplique o recurso groupby do pandas para processar e sintetizar conjuntos de dados; analise e manipule dados de séries temporais regulares e irregulares.
2 de fevereiro de 2021 -
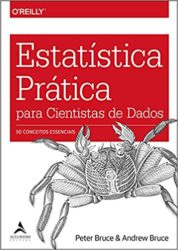 Estatística Prática Para Cientistas de Dados: 50 Conceitos Essenciais
Métodos estatísticos são uma parte crucial da ciência de dados; ainda assim, poucos cientistas de dados têm formação estatística. Os cursos e livros sobre estatística básica raramente abordam os tópicos sob a perspectiva da ciência de dados. Este guia prático explica como aplicar diversos métodos estatísticos em ciência de dados, ensina a evitar seu mau uso e aconselha sobre o que é importante e o que não é. Muitos recursos da ciência de dados incorporam métodos estatísticos, mas carecem de uma perspectiva estatística aprofundada. Se você está familiarizado com a linguagem de programação R e tem algum conhecimento estatístico, este guia fará a ponte de forma fácil e acessível. Com este livro, você aprenderá: - Por que a análise exploratória de dados é um passo prévio importante na ciência de dados - Como a amostragem aleatória pode reduzir o viés e resultar um conjunto de dados de maior qualidade, mesmo em big data - Como os princípios do design experimental resultam respostas definitivas - Como usar regressão para estimar resultados e detectar anomalias - Principais técnicas de classificação para prever a quais categorias um registro pertence - Métodos de aprendizado de máquina estatístico que “aprendem” com os dados - Métodos de aprendizado não supervisionado para extração de significado de dados não rotulados.
-
 R in Action: Data Analysis and Graphics with R
R in Action, Second Edition presents both the R language and the examples that make it so useful for business developers. Focusing on practical solutions, the book offers a crash course in statistics and covers elegant methods for dealing with messy and incomplete data that are difficult to analyze using traditional methods. You'll also master R's extensive graphical capabilities for exploring and presenting data visually. And this expanded second edition includes new chapters on time series analysis, cluster analysis, and classification methodologies, including decision trees, random forests, and support vector machines.
Purchase of the print book includes a free eBook in PDF, Kindle, and ePub formats from Manning Publications.
About the Technology
Business pros and researchers thrive on data, and R speaks the language of data analysis. R is a powerful programming language for statistical computing. Unlike general-purpose tools, R provides thousands of modules for solving just about any data-crunching or presentation challenge you're likely to face. R runs on all important platforms and is used by thousands of major corporations and institutions worldwide.
About the Book
R in Action, Second Edition teaches you how to use the R language by presenting examples relevant to scientific, technical, and business developers. Focusing on practical solutions, the book offers a crash course in statistics, including elegant methods for dealing with messy and incomplete data. You'll also master R's extensive graphical capabilities for exploring and presenting data visually. And this expanded second edition includes new chapters on forecasting, data mining, and dynamic report writing.
What's Inside
- Complete R language tutorial
- Using R to manage, analyze, and visualize data
- Techniques for debugging programs and creating packages
- OOP in R
- Over 160 graphs
About the Author
Dr. Rob Kabacoff is a seasoned researcher and teacher who specializes in data analysis. He also maintains the popular Quick-R website at statmethods.net.
Table of Contents
- Introduction to R
- Creating a dataset
- Getting started with graphs
- Basic data management
- Advanced data management
- Basic graphs
- Basic statistics
- Regression
- Analysis of variance
- Power analysis
- Intermediate graphs
- Resampling statistics and bootstrapping
- Generalized linear models
- Principal components and factor analysis
- Time series
- Cluster analysis
- Classification
- Advanced methods for missing data
- Advanced graphics with ggplot2
- Advanced programming
- Creating a package
- Creating dynamic reports
- Advanced graphics with the lattice package available online only from manning.com/kabacoff2
-
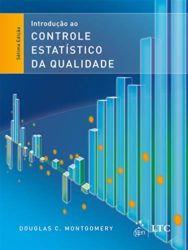 Introdução ao Controle Estatístico da Qualidade
Mais de 40 anos de ensino, pesquisa e consultoria na aplicação de métodos estatísticos resultaram na obra Introdução ao Controle Estatístico da Qualidade que vem atender às demandas pela busca por conhecimento de processos que visam à melhoria da qualidade. Nesta 7ª edição, os leitores poderão contar com: • material inédito sobre vários assuntos, incluindo a aplicação das ferramentas da qualidade, o monitoramento de processos de Bernoulli e de processos com baixos níveis de defeitos, entre outros; • mais de 24 novas referências acrescentadas à bibliografia, o que reflete em uma exposição mais clara e mais atual de muitos tópicos; • mais de 80 exercícios acrescentados aos conjuntos de problemas de final de capítulo. Os estudantes e docentes contam também com materiais suplementares disponíveis no site da LTC Editora - GEN | Grupo Editorial Nacional, mediante cadastro, para aprofundar o apoio pedagógico. De modo claro e abrangente, o livro mostra que a qualidade deve ser a principal e mais eficaz estratégia de negócio presente nas companhias, despontando como vantagem competitiva de mercado.
-
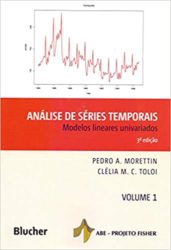 Análise de Séries Temporais: Modelos Lineares Univariados
O texto é adequado a estudantes de várias áreas do conhecimento: estatística, matemática, engenharia, economia, finanças, oceanografia, meteorologia, etc. São descritos modelos e procedimentos para a análise de séries temporais que ocorrem nestes diversos campos, bem como são discutidos exemplos de aplicações a séries reais.O livro traz um roteiro que sugere como utilizá-lo em diversos tipos de cursos.
-
 Data Analysis Using Hierarchical Generalized Linear Models with R
Since their introduction, hierarchical generalized linear models (HGLMs) have proven useful in various fields by allowing random effects in regression models. Interest in the topic has grown, and various practical analytical tools have been developed. This book summarizes developments within the field and, using data examples, illustrates how to analyse various kinds of data using R. It provides a likelihood approach to advanced statistical modelling including generalized linear models with random effects, survival analysis and frailty models, multivariate HGLMs, factor and structural equation models, robust modelling of random effects, models including penalty and variable selection and hypothesis testing.
-
 Generalized Linear Models for Insurance Data (International Series on Actuarial Science)
This is the only book actuaries need to understand generalized linear models (GLMs) for insurance applications. GLMs are used in the insurance industry to support critical decisions. Until now, no text has introduced GLMs in this context or addressed the problems specific to insurance data. Using insurance data sets, this practical, rigorous book treats GLMs, covers all standard exponential family distributions, extends the methodology to correlated data structures, and discusses recent developments which go beyond the GLM. The issues in the book are specific to insurance data, such as model selection in the presence of large data sets and the handling of varying exposure times. Exercises and data-based practicals help readers to consolidate their skills, with solutions and data sets given on the companion website. Although the book is package-independent, SAS code and output examples feature in an appendix and on the website. In addition, R code and output for all the examples are provided on the website.
-
 An Introduction to Generalized Linear Models
An Introduction to Generalized Linear Models, Fourth Edition provides a cohesive framework for statistical modelling, with an emphasis on numerical and graphical methods. This new edition of a bestseller has been updated with new sections on non-linear associations, strategies for model selection, and a Postface on good statistical practice.
Like its predecessor, this edition presents the theoretical background of generalized linear models (GLMs) before focusing on methods for analyzing particular kinds of data. It covers Normal, Poisson, and Binomial distributions; linear regression models; classical estimation and model fitting methods; and frequentist methods of statistical inference. After forming this foundation, the authors explore multiple linear regression, analysis of variance (ANOVA), logistic regression, log-linear models, survival analysis, multilevel modeling, Bayesian models, and Markov chain Monte Carlo (MCMC) methods.
- Introduces GLMs in a way that enables readers to understand the unifying structure that underpins them
- Discusses common concepts and principles of advanced GLMs, including nominal and ordinal regression, survival analysis, non-linear associations and longitudinal analysis
- Connects Bayesian analysis and MCMC methods to fit GLMs
- Contains numerous examples from business, medicine, engineering, and the social sciences
- Provides the example code for R, Stata, and WinBUGS to encourage implementation of the methods
- Offers the data sets and solutions to the exercises online
- Describes the components of good statistical practice to improve scientific validity and reproducibility of results.
Using popular statistical software programs, this concise and accessible text illustrates practical approaches to estimation, model fitting, and model comparisons.
-
 Introduction to Linear Regression Analysis
"As with previous editions, the authors have produced a leading textbook on regression."
—Journal of the American Statistical AssociationA comprehensive and up-to-date introduction to the fundamentals of regression analysis
Introduction to Linear Regression Analysis, Fifth Edition continues to present both the conventional and less common uses of linear regression in today’s cutting-edge scientific research. The authors blend both theory and application to equip readers with an understanding of the basic principles needed to apply regression model-building techniques in various fields of study, including engineering, management, and the health sciences.
Following a general introduction to regression modeling, including typical applications, a host of technical tools are outlined such as basic inference procedures, introductory aspects of model adequacy checking, and polynomial regression models and their variations. The book then discusses how transformations and weighted least squares can be used to resolve problems of model inadequacy and also how to deal with influential observations. The Fifth Edition features numerous newly added topics, including:
- A chapter on regression analysis of time series data that presents the Durbin-Watson test and other techniques for detecting autocorrelation as well as parameter estimation in time series regression models
- Regression models with random effects in addition to a discussion on subsampling and the importance of the mixed model
- Tests on individual regression coefficients and subsets of coefficients
- Examples of current uses of simple linear regression models and the use of multiple regression models for understanding patient satisfaction data.
In addition to Minitab, SAS, and S-PLUS, the authors have incorporated JMP and the freely available R software to illustrate the discussed techniques and procedures in this new edition. Numerous exercises have been added throughout, allowing readers to test their understanding of the material.
Introduction to Linear Regression Analysis, Fifth Edition is an excellent book for statistics and engineering courses on regression at the upper-undergraduate and graduate levels. The book also serves as a valuable, robust resource for professionals in the fields of engineering, life and biological sciences, and the social sciences.
-
 Applied Linear Statistical Models with Student CD
Applied Linear Statistical Models 5e is the long established leading authoritative text and reference on statistical modeling, analysis of variance, and the design of experiments. For students in most any discipline where statistical analysis or interpretation is used, ALSM serves as the standard work. The text proceeds through linear and nonlinear regression and modeling for the first half, and through ANOVA and Experimental Design in the second half. All topics are presented in a precise and clear style supported with solved examples, numbered formulae, graphic illustrations, and "Comments" to provide depth and statistical accuracy and precision. Applications used within the text and the hallmark problems, exercises, projects, and case studies are drawn from virtually all disciplines and fields providing motivation for students in virtually any college. The Fifth edition provides an increased use of computing and graphical analysis throughout, without sacrificing concepts or rigor. In general, the 5e uses larger data sets in examples and exercises, and the use of automated software without loss of understanding.